NLP学习梳理
吴恩达《自然语言处理|natural language processing》Lesson1
Week1
flowchart LR |
Preprocess
Use the Natural Language Toolkit (NLTK) package, an open-source Python library for natural language processing.Use its Twitter dataset that contains 5000 positive tweets and 5000 negative tweets exactly and has been manually annotated.
import nltk # Python library for NLP |
# downloads sample twitter dataset |
Load dataset:
# select the set of positive and negative tweets |
nltk.corpus.twitter_samples作为一个特定的语料库加载器,它继承了NLTK语料库读取器的一些通用方法,并提供了一些特定于其数据结构的方法。以下是
twitter_samples对象最常用的方法:
fileids():
作用: 返回
twitter_samples语料库中所有可用文件的ID(即文件名)列表。示例:
Python
print(twitter_samples.fileids())
# 输出可能类似:['negative_tweets.json', 'positive_tweets.json', 'tweets.20150430-223406.json']
strings(fileid):
作用: 从指定的
fileid文件中提取并返回所有推文的纯文本内容,作为一个字符串列表。这是最常用的方法之一,因为它直接提供用于NLP处理的文本。参数:
fileid(字符串) - 要读取的文件ID,例如'positive_tweets.json'。示例:
Python
positive_tweets = twitter_samples.strings('positive_tweets.json')
print(positive_tweets[0])
tokenized(fileid):
作用: 从指定的
fileid文件中提取推文,并对每条推文进行分词(tokenize),返回一个列表的列表,其中每个内部列表代表一条推文的单词(或token)。参数:
fileid(字符串) - 要读取的文件ID。示例:
Python
tokenized_tweets = twitter_samples.tokenized('positive_tweets.json')
print(tokenized_tweets[0])
# 输出可能类似:['#FollowFriday', '@France_Inte', '@PKuchly57', '@Milipol_Paris', 'for', 'being', 'top', 'engaged', 'members', 'in', 'my', 'community', 'this', 'week', ':)']
docs(fileid):
作用: 从指定的
fileid文件中读取原始的 JSON 数据,并将其作为 Python 字典对象的生成器返回。每个字典代表一条推文的完整JSON结构。参数:
fileid(字符串) - 要读取的文件ID。示例:
Python
import json # 用于美化打印
raw_docs_generator = twitter_samples.docs('positive_tweets.json')
first_doc = next(raw_docs_generator)
print(json.dumps(first_doc, indent=2, ensure_ascii=False))总结
twitter_samples主要提供了这三个核心方法来访问其内置的Twitter数据:
fileids(): 查看有哪些数据文件可用。strings(): 获取纯文本推文列表(最常见用于直接的文本处理)。tokenized(): 获取已分词的推文列表(方便进行词级别的分析)。docs(): 获取原始的JSON字典列表(如果你需要推文的元数据,如ID、用户、时间等)。这些方法使得用户可以方便地加载和使用Twitter数据集,特别是在情感分析和其他推文文本处理任务中。
Be more familiar with your data:
print('Number of negative tweets: ', len(all_negative_tweets))
print('\nThe type of all_positive_tweets is: ', type(all_positive_tweets))
print('The type of a tweet entry is: ', type(all_negative_tweets[0]))The result is :
Number of negative tweets: 5000
The type of all_positive_tweets is: <class 'list'>
The type of a tweet entry is: <class 'str'>
print('\033[92m' + all_positive_tweets[random.randint(0,5000)])
# print negative in red
print('\033[91m' + all_negative_tweets[random.randint(0,5000)])Result:
@cosplayamerica I'll be there around 10. My train was delayed. :(Visualize:
fig = plt.figure(figsize=(5, 5))
# labels for the two classes
labels = 'Positives', 'Negative'
# Sizes for each slide
sizes = [len(all_positive_tweets), len(all_negative_tweets)]
# Declare pie chart, where the slices will be ordered and plotted counter-clockwise:
plt.pie(sizes, labels=labels, autopct='%1.1f%%',
shadow=True, startangle=90)
# Equal aspect ratio ensures that pie is drawn as a circle.
plt.axis('equal')
# Display the chart
plt.show()Visualizing the data is always a gooddd habit.
Data preprocessing:
For NLP, the preprocessing steps are comprised of the following tasks:
- Tokenizing the string
- Lowercasing
- Removing stop words and punctuation
- Stemming
nltk.download('stopwords')Stop words are words that don’t add significant meaning to the text.
import string # for string operations
from nltk.corpus import stopwords # module for stop words that come with NLTK
from nltk.stem import PorterStemmer # module for stemming
from nltk.tokenize import TweetTokenizer # module for tokenizing stringsRemove rubish text that is not helpful for our sentiment prediction task in Twitter dataset such as hashtag, retweet marks, and hyperlinks:
print('\033[94m')
# remove old style retweet text "RT"
tweet2 = re.sub(r'^RT[\s]+', '', tweet)
# remove hyperlinks
tweet2 = re.sub(r'https?:\/\/.*[\r\n]*', '', tweet2)
# remove hashtags
# only removing the hash # sign from the word
tweet2 = re.sub(r'#', '', tweet2)
print(tweet2)Run result:
@sd My beautiful sunflowers on a sunny Friday morning off :) sunflowers favourites happy Friday off…To tokenize means to split the strings into individual words without blanks or tabs. In this same step, we will also convert each word in the string to lower case. The tokenize module from NLTK allows us to do these easily:
print('\033[92m' + tweet2)
print('\033[94m')
# instantiate tokenizer class
tokenizer = TweetTokenizer(preserve_case=False, strip_handles=True,
reduce_len=True)
# strip_handles=True 以 @ 开头的用户名会被移除。这通常在情感分析等任务中很有用,因为用户名本身通常不包含情感信息,而可能是噪声。
# reduce_len=True 会将长度为3或更长的重复字符序列缩减为长度为3的序列。例如,"coooool" 会变成 "coool","loooooove" 会变成 "loove"。这对于处理口语化、带有情感色彩的重复字符(如 "happyyyyy")非常有用,可以减少词汇量的膨胀,并提高词形归一化的效果。
# tokenize tweets
tweet_tokens = tokenizer.tokenize(tweet2)
print()
print('Tokenized string:')
print(tweet_tokens)Result:
primary string:
My beautiful sunflowers on a sunny Friday morning off :) sunflowers favourites happy Friday off…Tokenized string:
['my', 'beautiful', 'sunflowers', 'on', 'a', 'sunny', 'friday', 'morning', 'off', ':)', 'sunflowers', 'favourites', 'happy', 'friday', 'off', '…']
这样整理不高效,我以后只整理主要思路和关键细节。总体代码可以自己敲一遍
import re |
Building and Visualizing word frequencies
def build_freqs(tweets, ys): |
def build_freqs(tweets, ys): |
def build_freqs(tweets, ys): |
# select some words to appear in the report. we will assume that each word is unique (i.e. no duplicates) |
fig, ax = plt.subplots(figsize = (8, 8)) |
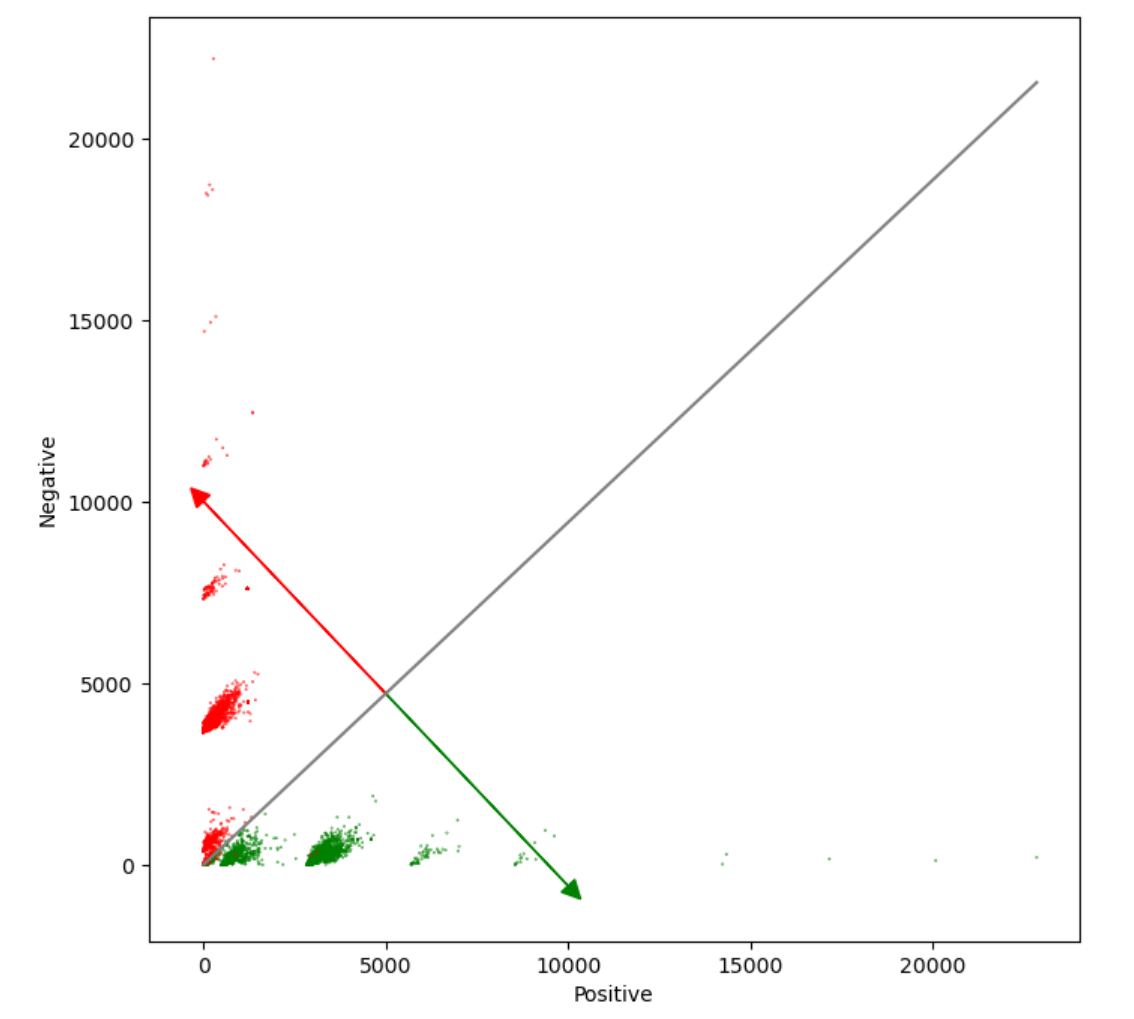
Visualizing tweets and the Logistic Regression model
学会了算决策边界,用z(x)= logistics regression函数当分类函数的话,z>=0.5可归为正类,z<0.5归为负类。而使得z(x)=0.5的x值为0所以$\theta \cdot x = 0$若$\theta$已知便可以得到决策边界。
所用分类函数的梯度方向为决策箭头的方向